Bought By: 6648
Rating: 4.4
Get Good Marks in your BA Psychology Programme in the Term-End Exams even if you are busy in your job or profession.
We've sold over 39,241,458 Help Books and Delivered 47,715,773 Assignments Since 2002.
As our customers will tell you...yes, it really result-oriented.
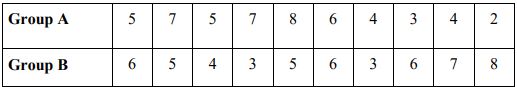
 3. The scores obtained by the two groups of students on achievement motivation scale are given as follows, compute t test and find if significant difference exists between the two groups:
 SECTION B
Answer the following questions in about 400 words (wherever applicable) each.
4. Describe various ways in which a data can be presented graphically with the help of suitable diagrams.
5. Compute mean and standard deviation for the following data:
23, 34, 56, 54, 45, 67, 65, 78, 76, 87
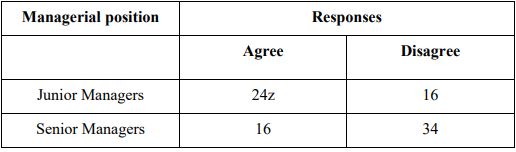
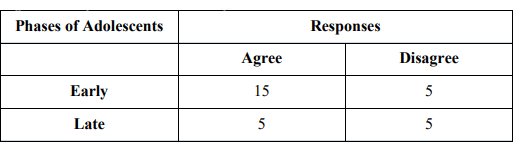
6. Compute Chi-square for the following data:
SECTION B
Answer the following questions in about 400 words (wherever applicable) each.
4. Describe various ways in which a data can be presented graphically with the help of suitable diagrams.
5. Compute mean and standard deviation for the following data:
23, 34, 56, 54, 45, 67, 65, 78, 76, 87
6. Compute Chi-square for the following data:
 7. Describe the properties and limitations of quartile deviation and average deviation.
8. Describe various scales of measurement with suitable examples.
SECTION C
Answer the following in about 50 words each
9. Importance of tabulation
10. Characteristics if a good measure of central tendency
11. Absolute and relative dispersion
12. Coefficient of variation
13. Direction of correlation
14. Disadvantages of nonparametric statistics
15. Test of independence as an application of chi-square test
16. Probability distribution
17. Skewness
18. The equation of normal curve
7. Describe the properties and limitations of quartile deviation and average deviation.
8. Describe various scales of measurement with suitable examples.
SECTION C
Answer the following in about 50 words each
9. Importance of tabulation
10. Characteristics if a good measure of central tendency
11. Absolute and relative dispersion
12. Coefficient of variation
13. Direction of correlation
14. Disadvantages of nonparametric statistics
15. Test of independence as an application of chi-square test
16. Probability distribution
17. Skewness
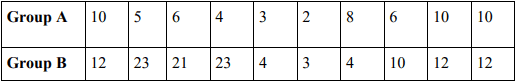
18. The equation of normal curve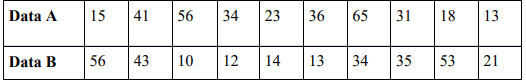 3. The scores obtained by the two groups of employees on self concept scale are given as follows, compute t test and find if significant difference exists between the two groups:
 SECTION B
Answer the following questions in about 400 words (wherever applicable)
4. Compute mean and standard deviation for the following data:
12, 13, 14, 15, 16, 23, 23, 12, 12, 10
5. Describe tabulation of data.
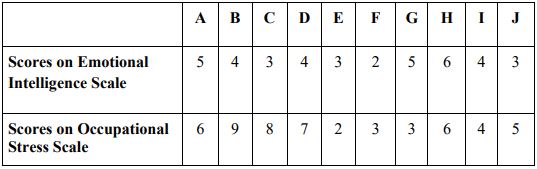
6. What are linear and non-linear relationships? Explain the direction of correlation.
7. Compute Chi-square for the following data:
SECTION B
Answer the following questions in about 400 words (wherever applicable)
4. Compute mean and standard deviation for the following data:
12, 13, 14, 15, 16, 23, 23, 12, 12, 10
5. Describe tabulation of data.
6. What are linear and non-linear relationships? Explain the direction of correlation.
7. Compute Chi-square for the following data:
 8. Explain the fundamental concepts in determining the significance of the difference between means.
SECTION C
Answer the following in about 50 words each
9. Cumulative frequency curve
10. Point estimation
11. Frequency polygon
12. Dispersion
13. Properties of quartile deviation
14. Scatter diagram
15. Parametric statistics
16. Kendall’s tau
17. Test of goodness of fit
18. Types of probability
8. Explain the fundamental concepts in determining the significance of the difference between means.
SECTION C
Answer the following in about 50 words each
9. Cumulative frequency curve
10. Point estimation
11. Frequency polygon
12. Dispersion
13. Properties of quartile deviation
14. Scatter diagram
15. Parametric statistics
16. Kendall’s tau
17. Test of goodness of fit
18. Types of probabilityTo attend IGNOU BPC-04 Term-End Examination, you must first submit your Assignments to the university and it is possible from the BPC-04 study material. You can solve all necessary Assignments using Help Books. This will help in gaining good marks.
All best wishes with our efforts that you do not meet any obstacle before attending examinations next year. You can pass the BA Psychology Programme Annual Exams with a good grade using Books/Materials from any one place at home or anywhere else!
ALL THE BEST!!!
Team GullyBaba