Bought By: 8710
Rating: 3.6
Get Good Marks in your BCA Mathematics Programme in the Term-End Exams even if you are busy in your job or profession.
We've sold over 39,328,740 Help Books and Delivered 47,834,365 Assignments Since 2002.
As our customers will tell you...yes, it really result-oriented.
 Q2. Given the following sample of 20 numbers:
15 45 52 43 50 59 41 47 56 79 72 18 45 54 78 12 41 48 58 14
(i) Compute mean, variance and standard deviation.
(ii) If the largest value in the above set of numbers is changed to 500, to what extent are the mean and variance affected by the change? Justify your answer.
Q3. (a) Write two merits and two demerits of Median.
(b) An incomplete frequency distribution is given as follows
12 30 ? 65 ? 25 18
Q2. Given the following sample of 20 numbers:
15 45 52 43 50 59 41 47 56 79 72 18 45 54 78 12 41 48 58 14
(i) Compute mean, variance and standard deviation.
(ii) If the largest value in the above set of numbers is changed to 500, to what extent are the mean and variance affected by the change? Justify your answer.
Q3. (a) Write two merits and two demerits of Median.
(b) An incomplete frequency distribution is given as follows
12 30 ? 65 ? 25 18
 Given that median value of 200 observations is 46, determine the missing frequencies using the median formula.
Q4. Box X contains 5 red and 4 blue balls, Box Y contains 2 red and 5 blue balls. A ball is drawn at random from each box. Find the probability of drawing one red and one blue ball.
Q5. A Manager of a car company wants to estimate the relationship between age of cars and annual maintenance cost. The following data from six cars of same model are obtained as:
Given that median value of 200 observations is 46, determine the missing frequencies using the median formula.
Q4. Box X contains 5 red and 4 blue balls, Box Y contains 2 red and 5 blue balls. A ball is drawn at random from each box. Find the probability of drawing one red and one blue ball.
Q5. A Manager of a car company wants to estimate the relationship between age of cars and annual maintenance cost. The following data from six cars of same model are obtained as:
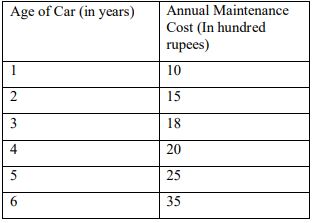 (a) Construct a scatter diagram for the data given above.
(b) Fit a best linear regression line, by considering annual maintenance cost as the dependent variable and the age of the car as the independent variable.
(c) Use this regression line to predict the annual maintenance cost for the car of age 8 years.
Q6. Suppose A and B are two independent events, associated with a random experiment. If the probability of occurrence of either A or B equals 0.6; while probability that only A occurs equals 0.4, then determine the probability of occurrence of event B.
Q7. A chemical firm wants to determine how four catalysts differ in yield. The firm runs the experiment in three of its plants, types A, B, C. In each plant, the yield is measured with each catalyst. The yield (in quintals) are as follows:
(a) Construct a scatter diagram for the data given above.
(b) Fit a best linear regression line, by considering annual maintenance cost as the dependent variable and the age of the car as the independent variable.
(c) Use this regression line to predict the annual maintenance cost for the car of age 8 years.
Q6. Suppose A and B are two independent events, associated with a random experiment. If the probability of occurrence of either A or B equals 0.6; while probability that only A occurs equals 0.4, then determine the probability of occurrence of event B.
Q7. A chemical firm wants to determine how four catalysts differ in yield. The firm runs the experiment in three of its plants, types A, B, C. In each plant, the yield is measured with each catalyst. The yield (in quintals) are as follows:
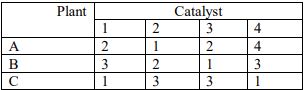 (a) Perform an ANOVA and comment whether the yield due to a particular catalyst is significant or not at 5% level of significance. Given F 3,6= 4.76.
(b) Construct ANOVA table for one-way classification.
Q8. Explain the following with the help of an example each:
a) Binomial distribution
b) t-test for mean
c) Properties of good estimator
d) F-test for Equality of two variances
(a) Perform an ANOVA and comment whether the yield due to a particular catalyst is significant or not at 5% level of significance. Given F 3,6= 4.76.
(b) Construct ANOVA table for one-way classification.
Q8. Explain the following with the help of an example each:
a) Binomial distribution
b) t-test for mean
c) Properties of good estimator
d) F-test for Equality of two variances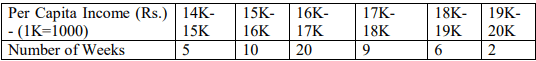 Draw a histogram and a frequency polygon on the same scale
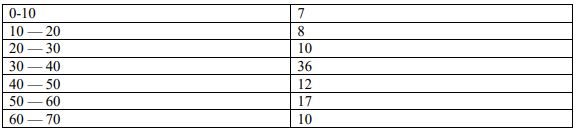
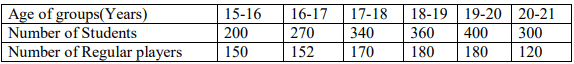
Q2. Do you find any correlation between ages and playing habits of the students, whose distribution according to age groups is given in the following table
Draw a histogram and a frequency polygon on the same scale
Q2. Do you find any correlation between ages and playing habits of the students, whose distribution according to age groups is given in the following table
 Q3. Data are given below shows statistics viz. standard deviation & average marks secured by students, in the examination of subject A and B
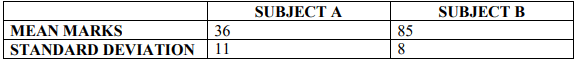 Assuming the Coefficient of correlation between A and B = ±0.66
Perform the following tasks:
i) Determine the two equations of regression
ii) Calculate the expected marks in A corresponding to 75 marks obtained in B.
Q4. Calculate 2-sigma and 3-sigma upper and lower control limits for means of samples 4 and prepare a control chart for a drilling machine, which bores holes with a mean deviation of 0.5230 cm and a standard deviation of 0.0032 cm.
Q5. Construct 5- yearly moving averages from the following data
Assuming the Coefficient of correlation between A and B = ±0.66
Perform the following tasks:
i) Determine the two equations of regression
ii) Calculate the expected marks in A corresponding to 75 marks obtained in B.
Q4. Calculate 2-sigma and 3-sigma upper and lower control limits for means of samples 4 and prepare a control chart for a drilling machine, which bores holes with a mean deviation of 0.5230 cm and a standard deviation of 0.0032 cm.
Q5. Construct 5- yearly moving averages from the following data
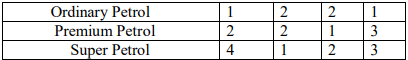 (i) Using ANOVA, test whether premium or super gives an extra mileage.
(ii) What is your estimate for the error variance?
(iii) Assuming that the error variance is known and is equal to 1, obtain the 95 % confidence interval for the mean extra mileage of super.
Q11. Two floppies are selected at random without replacement from a box containing 7 good and 3 defective floppies. Let A be the event that the first floppy drawn is defective, and let B be the event that the second floppy drawn is defective.
(i) Find the conditional probabilities P(B/A) and P(B/AC)
(ii) Show that P(B) = P(B/A). P(A) + P(B/AC) P(AC) = P(A).
Q12. A drilling machine bores holes with a mean deviation of 0.5230 cm and a standard deviation of 0.0032 cm. Calculate 2-sigma and 3-sigma upper and lower control limits for means of samples 4 and prepare a control chart.
Q13. What are control charts briefly discuss the utility of control charts?
Q14. Compare the following
a) Cluster sampling , Stratifies sampling and Systematic sampling
b) Parametric and Non-Parametric Tests
Q15. Explain the following with the help of an example each:
a) Goodness of fit test b) Test of Independence c) Criteria for a good estimator
d) Chi-Square Test
(i) Using ANOVA, test whether premium or super gives an extra mileage.
(ii) What is your estimate for the error variance?
(iii) Assuming that the error variance is known and is equal to 1, obtain the 95 % confidence interval for the mean extra mileage of super.
Q11. Two floppies are selected at random without replacement from a box containing 7 good and 3 defective floppies. Let A be the event that the first floppy drawn is defective, and let B be the event that the second floppy drawn is defective.
(i) Find the conditional probabilities P(B/A) and P(B/AC)
(ii) Show that P(B) = P(B/A). P(A) + P(B/AC) P(AC) = P(A).
Q12. A drilling machine bores holes with a mean deviation of 0.5230 cm and a standard deviation of 0.0032 cm. Calculate 2-sigma and 3-sigma upper and lower control limits for means of samples 4 and prepare a control chart.
Q13. What are control charts briefly discuss the utility of control charts?
Q14. Compare the following
a) Cluster sampling , Stratifies sampling and Systematic sampling
b) Parametric and Non-Parametric Tests
Q15. Explain the following with the help of an example each:
a) Goodness of fit test b) Test of Independence c) Criteria for a good estimator
d) Chi-Square TestTo attend IGNOU BCS-40 Term-End Examination, you must first submit your Assignments to the university and it is possible from the BCS-40 study material. You can solve all necessary Assignments using Help Books. This will help in gaining good marks.
All best wishes with our efforts that you do not meet any obstacle before attending examinations next year. You can pass the BCA Mathematics Programme Annual Exams with a good grade using Books/Materials from any one place at home or anywhere else!
ALL THE BEST!!!
Team GullyBaba